Nigel Parry/Lowertown.info—The Minnesota Department of Health’s changes to counting positive COVID-19 cases by date of sample—not by date of reporting—revealed that between March and May 2020 we had a profound blind spot in case awareness, sometimes resulting in a daily discrepancy of thousands between the number of reported and actual cases—all as the state was working around the clock to formulate policy informed by the best possible scientific advice.
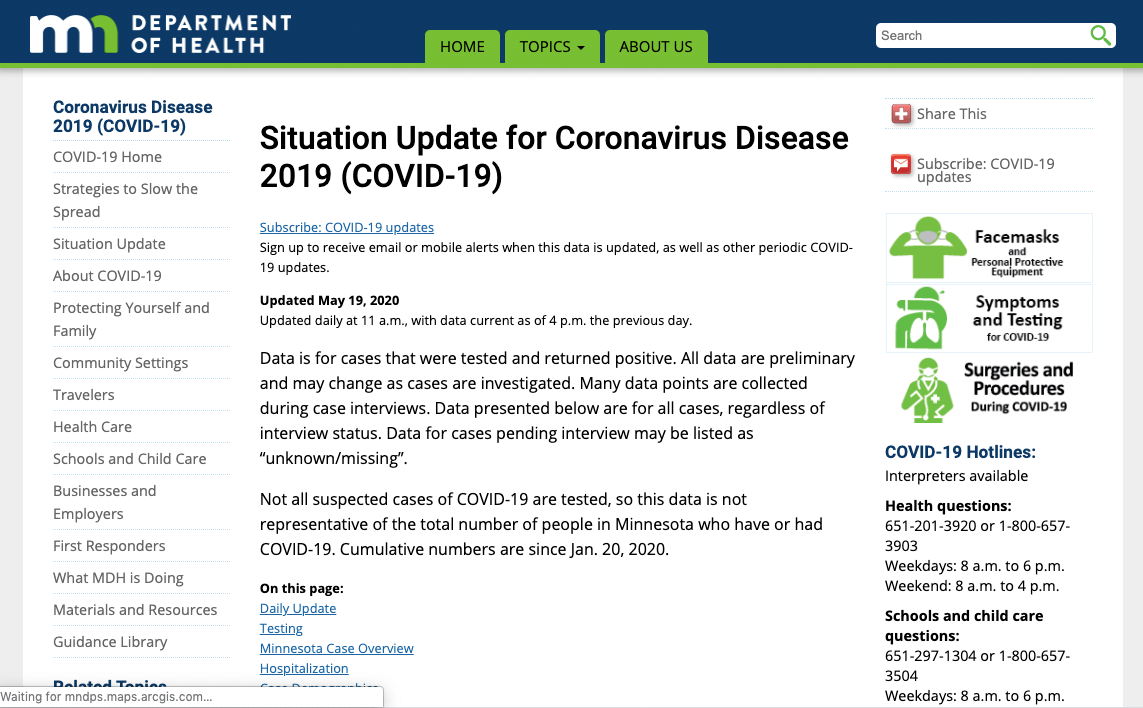
The Minnesota Department of Health first began posting its COVID-19 data online in its dedicated Situation Update for Coronavirus Disease 2019 (COVID-19) section, around the time of Minnesota’s first positive case was reported, on March 6th.
As the pandemic has unfolded, the Minnesota Department of Health has steadily improved its COVID-19 data collection and online data presentation as new systems have been put in place and new data has become available. Prior to March 29th, private testing data was not included in Minnesota’s ‘total tests taken’ metric. As time has progressed, the department has added new visualizations of data and new access to chart data in table format, increasing both useability and transparency of the state’s datasets.
On May 13th, just two months after the Minnesota Department of Health first began offering daily-updated COVID-19 statistics on its website, the agency changed the way it counts positive cases. Previously, it logged the date of a new positive case as the day it was first reported. The new text on their website said: “As of 5/13/2020, total case data is represented by specimen collection date. Cases over time were previously based on report date.”
Previously available positive case data had been removed, existing tables and charts retroactively updated back to early March to use only data from the new “date of sample” system.
Of course, information ‘gathered closer to the virus’ provides a better overall picture of viral spread and provides a medical—not administrative—date stamp for contact tracers. The change is obviously a sensible one.
The chart we had for Positive Cases prior to the change looked like this:
In its May 12th, 2020 media update, the Minnesota Department of Health explained the coming change in depth:
MDH will also update information they provide on specimen collection date instead of reported date. So what that means is, for their graph that shows the total positive cases over time, the MDH has been displaying this graph based on the date that the case was confirmed at MDH. They’re going to make a change, and that graph will now show cases by the date their specimen was collected. That’s the specimen that was tested and determined that they were positive for COVID-19. Using the date that a specimen was collected is a measure that’s more relevant to each case, and is in line with how other disease data is reported. It gives the MDH a better picture of what’s happening in Minnesota over time. Reporting cases this way removes the factor of reporting delays. In other words, for some out of state laboratories, it can take up to a week to get results. So it removes the factor of reporting delays and investigation timing, and more accurately reports when people in Minnesota have COVID. This does not change the MDH’s total case count, just the day that the case shows up on the graph.
I wondered how the two differing methods of counting positive cases had impacted the overall picture we had all had during those first two months. How did the plumbline we were all working from differ from the actual reality of the virus’ spread at the time?
The data previously displayed on the MN Department of Health’s website was gone with no obvious archive available. Fortunately, Lowertown.info has been archiving the raw data from the daily MN Department of Health’s COVID-19 Situation Update into its own visualizations, so both new and old data sets were available for comparison. Here are both visualized together—the red line shows cases with the new sample date method, the blue line cases logged under the former reporting date method:
“Just the day”
The MN Dept. of Health’s May 12th briefing reassured us that the new change in the way positive cases are counted “does not change the MDH’s total case count, just the day that the case shows up on the graph.”
Maybe that’s true in retrospect, if we are looking back at the whole period as a past event, but what effect did that reporting delay have on the number of positive cases that we were aware of at any one point in time?
A lot gets lost with the camera zoomed this far out.
Zooming in on March, April, and May
Here are the discrepancies between the old and new positive cases counts, visualized for the months of March, April, and May so far. Zoomed in, you can see that the old method was way behind the curve, vastly underestimating new daily cases .
The visualizations have tooltips if you hover over (desktop) or click on the lines (mobile). Explore the differences on different dates.
Notes:
- March 15th data shows 35 positive cases when counted by date of report and 125 cases when counted by date of sample, a difference of 90 cases and reporting of just 28% of the actual total at the time.
- March 30th data shows 576 positive cases when counted by date of report and 819 cases when counted by date of sample, a difference of 243 cases and reporting of just 70% of the actual total at the time.
Notes:
- April 7th data shows 1,069 positive cases when counted by date of report and 1,430 cases when counted by date of sample, a difference of 361 cases and reporting of just 75% of the actual total at the time.
- April 15th data shows 1,809 positive cases when counted by date of report and 2,319 cases when counted by date of sample, a difference of 510 cases and reporting of just 78% of the actual total at the time.
- April 23rd data shows 2,942 positive cases when counted by date of report and 4,264 cases when counted by date of sample, a difference of 1,322 cases and reporting of just 69% of the actual total at the time.
- April 30th data shows 5,136 positive cases when counted by date of report and 8,075 cases when counted by date of sample, a difference of 2,939 cases and reporting of just 64% of the actual total at the time.
Note:
- May 6th data shows 8,579 positive cases when counted by date of report and 11,389 cases when counted by date of sample, a difference of 2,810 cases and reporting of just 75% of the actual total at the time.
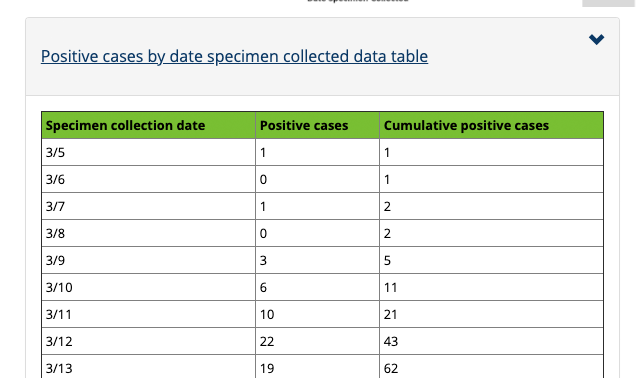
The two data sets for positive cases (by reporting and sample dates) are found at the bottom of this page in table form.
Daily undercounts of thousands of cases
The Minnesota Department of Health’s changes to counting positive COVID-19 cases by date of sample—not by date of reporting—revealed that between March and May 2020 we had a profound blind spot in case awareness, sometimes resulting in a daily discrepancy of thousands between the number of reported and actual cases—all as the state was working around the clock to formulate policy informed by the best possible scientific advice.
Starting March 17th, Minnesota Governor Tim Walz ordered all restaurants, bars, and cafes closed. On the day of the shutdown, the number of reported positive cases was just 60. In reality, the actual total was 242, four times the number we were all working off. Would the governor have acted sooner if he had known that the number of positive cases was four times higher than we all thought they were at the time? Even days make a difference.
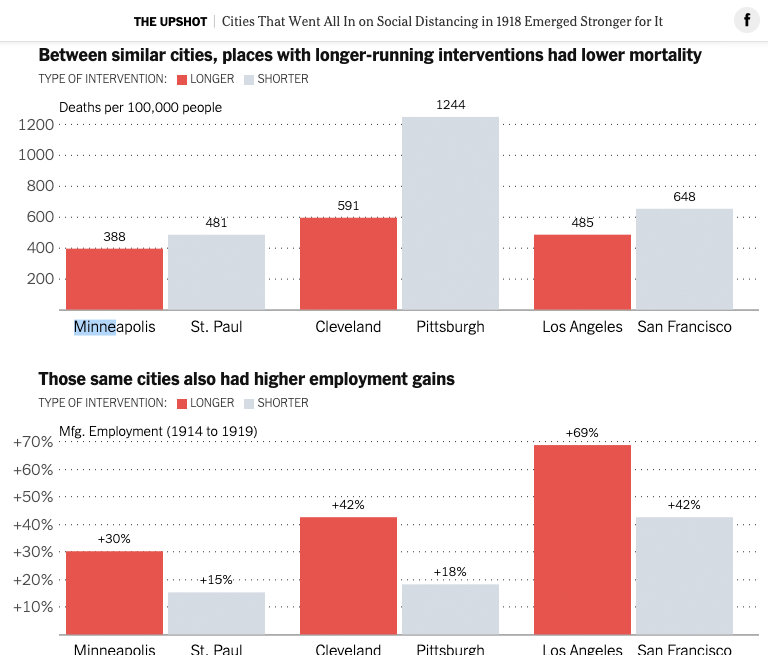
This is not nitpicking. In an April 3rd article in the New York Times, Cities That Went All In on Social Distancing in 1918 Emerged Stronger for It, the authors report how Minneapolis and Saint Paul fared relatively during the 1918 Influenza Epidemic. Saint Paul implemented its shutdown one week after Minneapolis. It saw 481 deaths per 100,000 compared with Minneapolis’ 388, one-and-a-quarter times higher. In terms of employment gains, Minneapolis saw double that of Saint Paul. It’s hard to argue with such a painfully relevant lesson from history that is literally this close to home.
From early March to mid-May, those responsible for Minnesotan public health policy were making decisions based on a significant underestimate of the number of positive COVID-19 cases in the state. Between March and May, the number of daily reported positive tests lagged 4-5 days behind the reality. Sometimes the daily discrepancy was as high as 3,000.
On April 9th, Minnesota media reported that “Gov. Tim Walz is extending a statewide stay-at-home order to May 4 to push the peak of the COVID-19 pandemic into the summer.” On April 9th, as far as we all were concerned, there were just 1,242 positive cases in the state. The correct number was 1,635—a difference of 393 or one-and-a-third times as many positive cases.
By the end of April, presumably around the time that Governor Walz was again making decisions about whether to extend the “Stay at Home” order in the face of political pressure, the undercount of positive cases was as high as 3,000, two-thirds of the actual number of cases. April 17th and May 2nd saw two “Reopen Minnesota” protests, the first outside the governor’s residence on Summit Avenue, the second around the State Capitol. Would knowing that we only were seeing a percentage of the actual cases have given pause to those gatherings?
When did it all even begin in Minnesota? March 6th had become the accepted milestone of the first Minnesotan positive case. The new “date by sample taken” data reveals that the first positive test was in fact conducted the day before, on March 5th.
As of May 13th and ongoing, Minnesota Department of Health positive case data is being both retroactively and daily presented by date of sample, not date of report. Lowertown.info will likely be reworking its various visualizations to preserve and reflect the data showing the first three months’ underreporting. From the looks of today’s positive chart on the Minnesota Department of Health’s website, the state is in the process of doing the same.
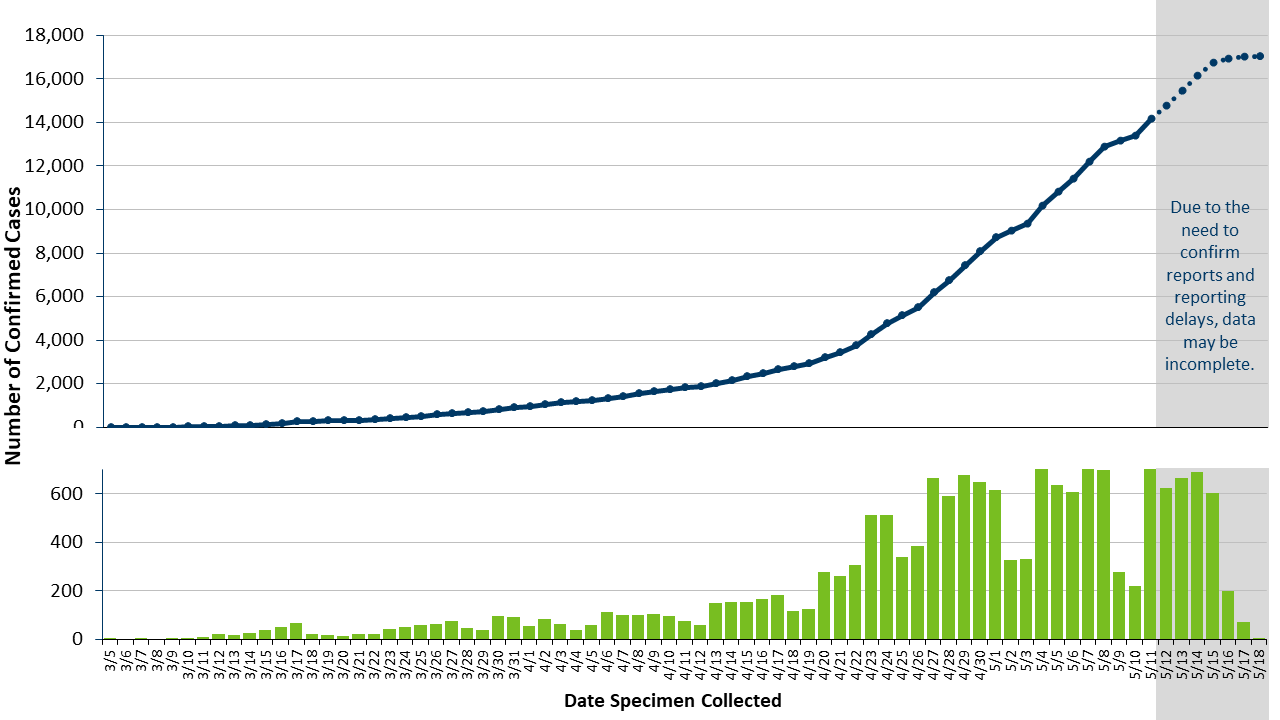
Positive cases graphic from the Minnesota Department of Health’s website today (click to enlarge).
Will the new “date of sample” data still be compiled several days after the fact? It looks like it from the gray area displayed in the new MN Dept. of Health charts (pictured above). This short YouTube video explains the phenomenon of “data lag” and how that affects perceptions of curve peaking and flattening:
Minnesota COVID-19 Positive Results by Reporting Date & Sample Date
| Date | Positive (by reporting date) | Positive (by sample date) |
|---|---|---|
| Mar 5 | 0 | 1 |
| Mar 6 | 1 | 1 |
| Mar 7 | 1 | 2 |
| Mar 8 | 1 | 2 |
| Mar 9 | 2 | 5 |
| Mar 10 | 3 | 11 |
| Mar 11 | 5 | 21 |
| Mar 12 | 5 | 43 |
| Mar 13 | 14 | 62 |
| Mar 14 | 21 | 87 |
| Mar 15 | 35 | 125 |
| Mar 16 | 54 | 175 |
| Mar 17 | 60 | 242 |
| Mar 18 | 77 | 265 |
| Mar 19 | 89 | 283 |
| Mar 20 | 115 | 299 |
| Mar 21 | 138 | 323 |
| Mar 22 | 169 | 345 |
| Mar 23 | 235 | 389 |
| Mar 24 | 262 | 299 |
| Mar 25 | 287 | 323 |
| Mar 26 | 346 | 562 |
| Mar 27 | 398 | 636 |
| Mar 28 | 441 | 683 |
| Mar 29 | 503 | 721 |
| Mar 30 | 576 | 819 |
| Mar 31 | 629 | 912 |
| Apr 1 | 689 | 969 |
| Apr 2 | 742 | 1053 |
| Apr 3 | 789 | 1116 |
| Apr 4 | 865 | 1156 |
| Apr 5 | 935 | 1215 |
| Apr 6 | 986 | 1328 |
| Apr 7 | 1069 | 1430 |
| Apr 8 | 1154 | 1532 |
| Apr 9 | 1242 | 1635 |
| Apr 10 | 1336 | 1730 |
| Apr 11 | 1427 | 1804 |
| Apr 12 | 1621 | 1862 |
| Apr 13 | 1650 | 2010 |
| Apr 14 | 1695 | 2163 |
| Apr 15 | 1809 | 2319 |
| Apr 16 | 1912 | 2484 |
| Apr 17 | 2071 | 2666 |
| Apr 18 | 2213 | 2784 |
| Apr 19 | 2356 | 2910 |
| Apr 20 | 2470 | 3188 |
| Apr 21 | 2567 | 3449 |
| Apr 22 | 2721 | 3753 |
| Apr 23 | 2942 | 4264 |
| Apr 24 | 3185 | 4776 |
| Apr 25 | 3446 | 5115 |
| Apr 26 | 3602 | 5499 |
| Apr 27 | 3816 | 6161 |
| Apr 28 | 4181 | 6751 |
| Apr 29 | 4644 | 7429 |
| Apr 30 | 5136 | 8075 |
| May 1 | 5730 | 8689 |
| May 2 | 6228 | 9016 |
| May 3 | 6663 | 9349 |
| May 4 | 7234 | 10158 |
| May 5 | 7851 | 10788 |
| May 6 | 8579 | 11389 |
| May 7 | 9365 | 12181 |
| May 8 | 10088 | 12809 |
| May 9 | 10790 | 13073 |
| May 10 | 11271 | 13244 |
| May 11 | 11799 | 13839 |
| May 12 | 12494 | 14122 |
| May 13 | 14230 | 14230 |
Related Links
- Ramsey County’s “COVID-19 Situation Update” dashboard
- Minnesota Department of Health’s Situation Update for Coronavirus Disease 2019 (COVID-19) section
- Lowertown.info’s Minnesota COVID-19 Statistics & Charts page
Key Local Resources
- FREE TESTING
- GET VACCINATED
- Minnesota COVID-19 Situation Update - Minnesota Department of Health (MN DoH)
- Ramsey County COVID-19 Situation Update - Ramsey County
- St. Paul COVID-19 Public Information (Road closures, Free meal services, PPE donation locations, Testing locations, etc) - City of St. Paul
- Governor Tim Walz's Executive Orders
- Coronavirus Outbreak Information - Minnesota Department of Health (MN DoH)
- Coronavirus Disease 2019 (COVID-19) - Ramsey County
- Advice for People at Risk for Serious Illness from COVID-19 - Minnesota Department of Health (MN DoH)
- Community-level strategies to slow COVID-19 - Minnesota Department of Health (MN DoH)
- Coronavirus Almanac Special - from Twin Cities Public Television (TPT), including a helpful "How to talk to your kids about Coronavirus" article
Key National Resources
- Johns Hopkins Coronavirus Resource Center
- Center for Disease Control (CDC) - COVID-19 information
- Coronavirus Disease 2019 (COVID-19) situation reports - Center for Disease Control (CDC)
- U.S. Food and Drug Administration - Coronavirus Disease 2019 (COVID-19)
- Coronavirus: Fact vs Fiction - a helpful podcast from CNN Chief Medical Correspondent Dr. Sanjay Gupta
Key International Resources
- World Health Organization (WHO) - COVID-19 information
- Coronavirus disease (COVID-2019) daily situation reports (global and by country) - World Health Organization (WHO)